Widgets
Widget is the basic visualization element at Wizz-Vis. It represent a KPI selecting Dimensions and Aggregators from a Datasource. The style and behavior could be modified with the built-in options from each widget.
This document is a guide to introduce the wide variety of widgets and will instruct the creation depending on the widget type and the data wants to be show.
Attributes
Each widget has the below attributes. Some of them are optional attributes, depending on the widget’s type. Each particularity will be referenced later in each widget’s section.
- datasource_id [ID]
- dashboard_id [ID]
- title [String]
- row [Integer]
- col [Integer]
- size_x [Integer]
- size_y [Integer]
- type [String]
- range [String]
- start_time [DateTime]
- end_time [DateTime]
- granularity [String]
- limit [Integer]
- options [Hash/JSON]
Also, widgets have relations with other entities:
- dimensions [Array]
- aggregators [Array]
- post_aggregators [Array]
- filters [Array]
datasource_id
Required
Association for the Druid’s datasource.
dashboard_id
Required
Association for the dashboard selected to contain the widget.
row and col
Required
Represent the row and column of the widget in the dashboard that is contained.
size_x and size_y
Required
These attributes represent the width and height of the widget in the dashboard that is contained.
Dashboard are grid based with 12 columns, so size_x has to be between 1 and 12.
type
This attribute will determine the type of widget to be represented.
- WidgetSerie
- WidgetBar
- WidgetPie
- WidgetValue
- WidgetTable
- WidgetHeatmap
- WidgetLocation
- WidgetPlaneLocation
- WidgetPlane
- WidgetSankey
- WidgetChord
- WidgetMultiserie
- WidgetRoute
- WidgetPlaneRoute
- WidgetImage
- WidgetHistogram
- WidgetText
range
This attribute is used to set the interval.
The possible values are:
- last_30_minutes
- last_1_hour
- last_6_hours
- last_1_day
- last_7_days
- last_30_days
- current_day
- current_week
- current_month
- previous_day
- previous_week
- previous_month
These are the predefined ranges. Also, we can use last ranges with the format last_x_y, where x should be a float number and y one of seconds, minutes, hours, days, weeks or months.
start_time and end_time
Used to include a fixed interval. If range is setted, these attributes are ignored.
The format used is:
YYYY-mm-dd HH:MM:SS
For example:
2016-11-04 18:55:00
granularity
The values allowed for granularity are:
- all
- minute
- fifteen_minute
- thirty_minute
- hour
- day
Also, granularity can be represented with period:
- PT1M
- PT15M
- PT30M
- PT1H
- P1D
Widgets which must have the granularity set to all, do not need to indicate the granularity at the time of creation.
If a widget with granularity other than all has no granularity setted, it will be assigned one related to the selected time interval. Otherwise, it will use its own granularity.
- PT1M: Less than or equal to one hour
- PT5M: From one to six hours
- PT1H: From six hours to one week
- P1D: From one week to three months
- P1W: From three months to one year
- P1M: More than one year
You have more information in Druid docs: Aggregation Granularity.
limit
Some widgets need the limit attribute to restrict the number of elements to be returned.
By default, the limit will be 5.
options
This attribute is used to modify the style and behavior of some widgets. The content depends on the type of widget created.
For all widgets, we can specify an image or a background color as follows:
{
  "background": {
    "image": "http://www.aerobusbcn.com/sites/default/media/fira2.jpg",
    "opacity": "0.3"
  }
}
{
  "background": {
    "color": "#ffff00" | "transparent"
  }
}
We will cover specific parameters later.
dimensions
Each widget could represent one or more dimensions, depending on widget’s type.
Note: Only dimensions that belong to the datasource selected could be used.
aggregators
Each widget could represent one or more aggregator, depending on widget’s type. Also, aggregators could be used to be referenced by post aggregators.
Note: Only aggregators that belong to the datasource selected could be used.
post_aggregators
Various aggregators could be combined between them and make operations, resulting in a new metric to be used by the widget to be represented.
Note: The aggregators referenced by the post aggregators have to be included as aggregators themselves.
ProTip: If more than one aggregator or post aggregator has been defined, we can select which metric or metrics will be represented in the widget using the property metrics at options attribute.
For instance, if we have included as aggregators flows and events and then a post aggregator named flows_per_event, we can select that only the last one is represented.
filters
Widget’s data can be filter, indicating which rows of data should be included in the computation for a query. It’s essentially the equivalent of the WHERE clause in SQL. Wizz-vis supports the following types of filters:
- Equality
- Inequality
- Comparasion
- Regexp
Widget Types
WidgetSerie
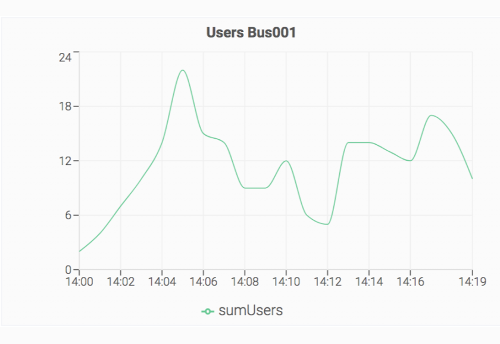
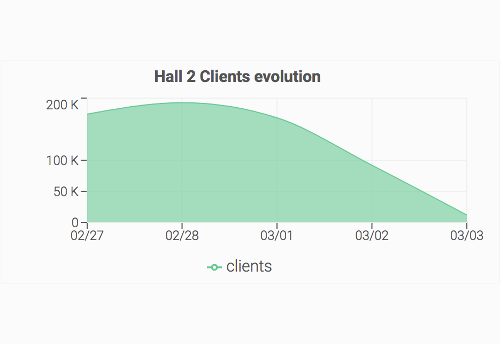
This type of widget will represent timeseries, so the attributes necessaries, in addition to the required ones, are:
- granularity (one different to all)
- aggregators (at least one)
We can select between three types of chart. It can be configured through options attribute with one of these values:
- line
- area
- bar
{
  "type": "area"
}
By default, if no value is provided, line will be used.
This widget also has the compare and threshold features available.
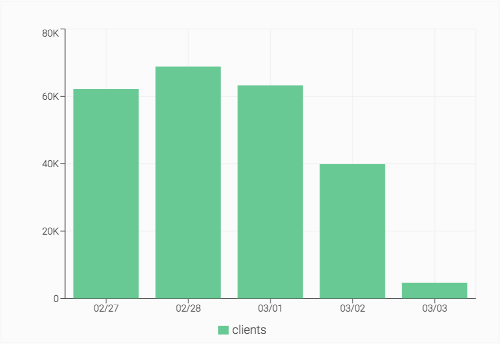
WidgetBar
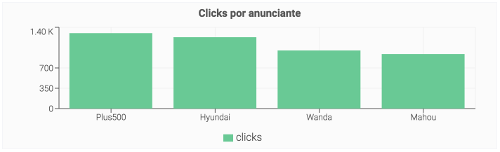
It will represent a TopN query. In addition to the required attributes, we have to set:
- dimensions (one)
- aggregators (one)
- limit
If more than one aggregator is set, only one will be represented (or a post aggregation that use these aggregators if necessary).
We can set the main color of the graph through the options attribute.
{
  "color": "red" | "#ff0000"
}
This widget also has the threshold feature available.
WidgetPie
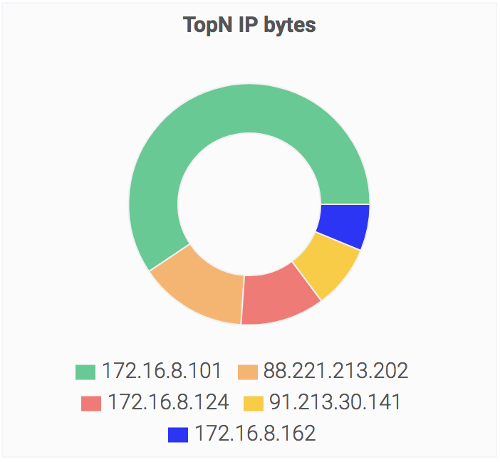
It will represent a TopN query. In addition to the required attributes, we have to set:
- dimensions (one)
- aggregators (one)
- limit
WidgetValue
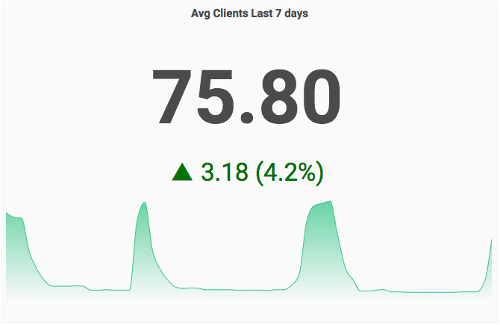
It will represent a single value looking at the max, min, average of sum of values in the serie returned. Also, the serie and a gauge with thresholds could be represented in the widget.
In addition to the required attributes, we have to set:
- granularity
- aggregators (one)
- options
We can select between various ways of getting the value from the timeserie query that the widget made. It can be configured through options attribute with one of these values:
- current (last value returned in the serie)
- max
- min
- average
- total
By default, if no value is provided, current will be used.
{
  "value": "average"
}
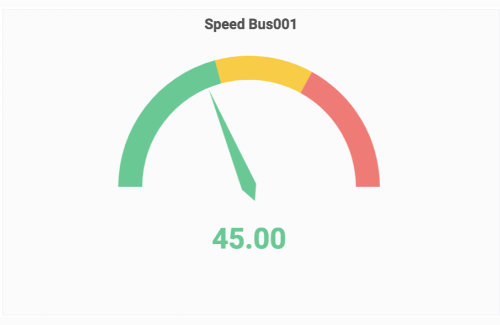
If we want to represent a gauge, options must be set as:
{
  "gauge": {
    "show": true,
    "max": 500000,
    "thresholds": [
      [0.25, "#3DCC91"],
      [0.5, "#FFCC00"],
      [0.75, "#FFB366"],
      [1, "#FF7373"]
    ]
  }
}
If we want to represent the serie with a custom color, options must be set as:
{
  "serie": {
    "show": true,
    "color": "yellow" | "#ffff00" (default: #3DCC91)
  }
}
This widget also has the compare feature available.
WidgetTable
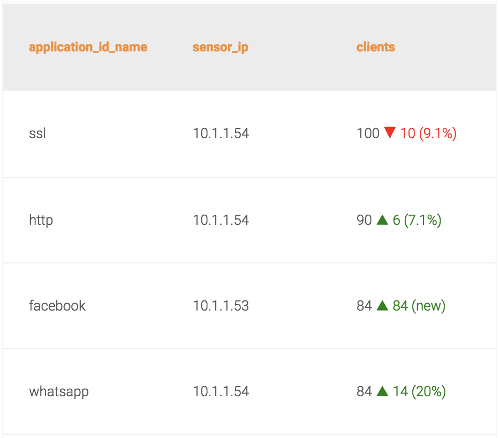
It will represent a TopN or GroupBy query. In addition to the required attributes, we have to set:
- dimensions (at least one)
- aggregators (at least one)
- limit
This widget also has the compare feature available.
If the table use more than one aggregator, we can select which ones use the compare feature through the compare option at options attribute:
"compare": {
  "range": "previous_period",
  "aggregators": ["events"]
}
If the aggregators option is not included, all aggregators used in the table will show the compare info.
WidgetHeatmap
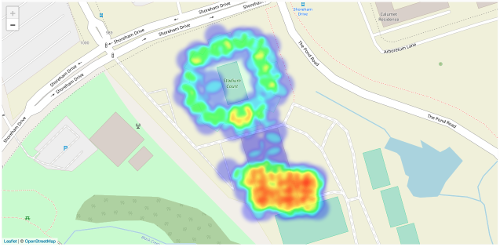
- dimensions (one, representing coordinates)
- aggregators (one)
- limit
Also, we can set the visibility of the legend, or the size, color and behavior of each point through the options attribute.
"options": {
  "legend": true | false, (default: true)
  "max_zoom": 15, (default: 1)
  "max_value": "max" | "average" | Number, (default: "max")
  "blur": 5, (default: 10)
  "radius": 15, (default: 20)
  "gradient": {
    "0.4": "blue", "0.6": "cyan", "0.7": "lime",
    "0.8": "yellow", "1.0": "red" (default colors)
  }
}
max_zoom: maximum zoom for heatmap. For higher values of this zoom value, each point represents its maximum intensity.max_value: max intensity value for heatmap. This aggregation value will be represented in red and the rest of the colors will be calculated proportionally. Higher aggregation values will always be red. You can adjust it to the higher or lower aggregation value presented in the widget. By default, it assigns the max of the aggregation values of all the points.blur: blur for heatmap points.radius: radius for heatmap points.gradient: object defining gradient stop points for heatmap.
WidgetLocation
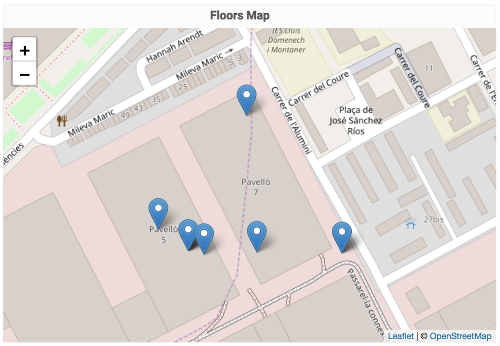
There are two ways to represent this widget. One of them using the coordinates as a dimension and another one using the coordinates as a aggregator.
In the dimension way, we have to set, apart to the required attributes:
- dimensions (two or more, one representing coordinates and the others to tag the marker)
- aggregators (at least one)
- granularity (one different to
all) - limit
In the aggregator way, we have to set, apart to the required attributes:
- dimensions (at least one)
- aggregators (at least one, one representing coordinates as stringLast or stringFirst aggregator)
- granularity (
all) - limit
WidgetPlaneLocation
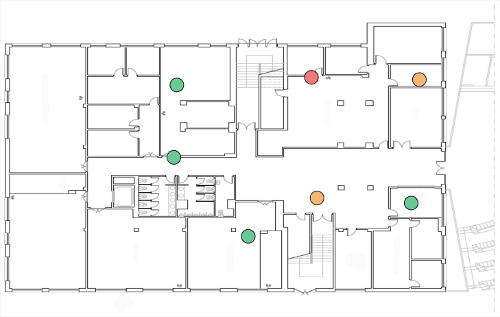
Similar to WidgetLocation, but representing the markers over an image instead of a map.
There are two ways to represent this widget. One of them using the coordinates as a dimension and another one using the coordinates as a aggregator.
In the dimension way, we have to set, apart to the required attributes:
- dimensions (two or more, one representing coordinates and the others to tag the marker)
- aggregators (at least one)
- granularity (one different to
all) - limit
In the aggregator way, we have to set, apart to the required attributes:
- dimensions (at least one)
- aggregators (at least one, one representing coordinates as stringLast or stringFirst aggregator)
- granularity (
all) - limit
It needs GPS markers to convert the latitude-longitude data to x-y points. Al least, three gps markers have to be configured.
x-y points are references for a image point starting at top-left corner of the image.
To keep the proportions of the used image, we have to use keep_ratio property.
The options attribute would be as follows:
{
  "image": "https://www.bookingtaxibarcelona.com/wp-content/uploads/2015/03/fira-gran-via-map.png",
  "keep_ratio": true,
  "gps_markers": [
    { "x": 261, "y": 208, "latitude": 41.355151, "longitude": 2.127733 },
    { "x": 530, "y": 217, "latitude": 41.357172, "longitude": 2.130533 },
    { "x": 785, "y": 406, "latitude": 41.3559, "longitude": 2.138092 }
  ]
}
Also, the marker’s color could be configured through thresholds. They can be configured with the options attribute.
{
  "threshold_metric": "events",
  "thresholds": [
    [200, "#3DCC91"],
    [500, "#FFB366"],
    [900, "#FF7373"]
  ]
}
So, if the marker is above 500 but below 900 for the configured metric, it will have the color #FFB366.
If no threshold_metric is configured, it will use the first aggregator configured for the widget to calculate the marker’s color.
WidgetPlane
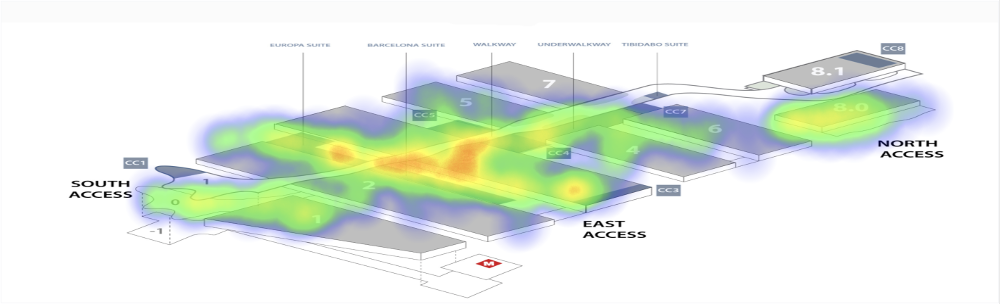
Similar to WidgetHeatmap, but representing the data over an image instead of a map.
- dimensions (one, representing coordinates)
- aggregators (one)
- limit
It needs GPS markers to convert the latitude-longitude data to x-y points. Al least, three gps markers have to be configured.
x-y points are references for a image point starting at top-left corner of the image.
To keep the proportions of the used image, we have to use keep_ratio property.
We can show or hide the legend through the legend property by setting it to true or false (default to true).
The options attribute would be as follows:
{
  "max_value": "max" | "average" | Number, (default: "max")
  "opacity": 0.5, (default: 1)
  "radius": 15, (default: 40)
  "image": "https://www.bookingtaxibarcelona.com/wp-content/uploads/2015/03/fira-gran-via-map.png",
  "keep_ratio": true,
  "gps_markers": [
    { "x": 261, "y": 208, "latitude": 41.355151, "longitude": 2.127733 },
    { "x": 530, "y": 217, "latitude": 41.357172, "longitude": 2.130533 },
    { "x": 785, "y": 406, "latitude": 41.3559, "longitude": 2.138092 }
  ],
  "legend": false
}
WidgetSankey
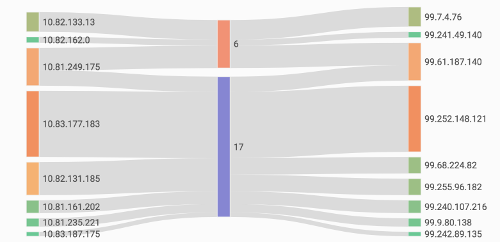
It will represent a GroupBy query. In addition to the required attributes, we have to set:
- dimensions (two or more)
- aggregators (one)
- limit
The order of the dimensions is a bit random. So the order could be set in the options attribute:
{
  "ordered_dimensions": ["src_ip", "protocol", "dst_ip"]
}
The name of dimensions at ordered_dimensions should be the same as those configured at dimensions relation.
WidgetChord
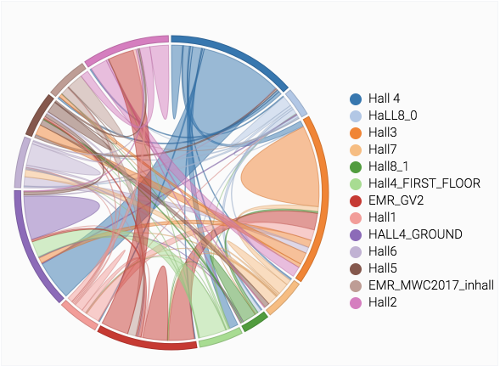
It will represent a GroupBy query. In addition to the required attributes, we have to set:
- dimensions (two: origin and destination)
- aggregators (one)
- limit
The order of the dimensions is a bit random. So the origin and the destination to calculate the matrix values can be set in the options attribute. Also, we can set the legend option:
{
  "legend": true,
  "origin": "src",
  "destination": "dst"
}
WidgetMultiserie
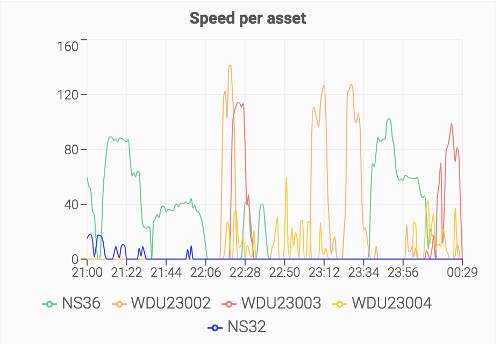
It will represent a Timeserie query for each value obtained from a TopN query. In addition to the required attributes, we have to set:
- dimensions (one)
- aggregators (one)
- granularity (one different to
all) - limit
We can select between three types of chart. It can be configured through options attribute, setting the type property, with one of these values:
- line
- area
- bar
By default, if no value is provided, line will be used.
We can set the stacked property to true or false if we want the graphs to be stacked.
This widget also has the threshold feature available.
options attribute example:
{
  "type": "area",
  "stacked": true,
  "thresholds": [
    { "value": 200000000, "color": "red", "label": "Threshold 1" },
    { "value": 100000000, "color": "#000000", "label": "Threshold 2" }
  ]
}
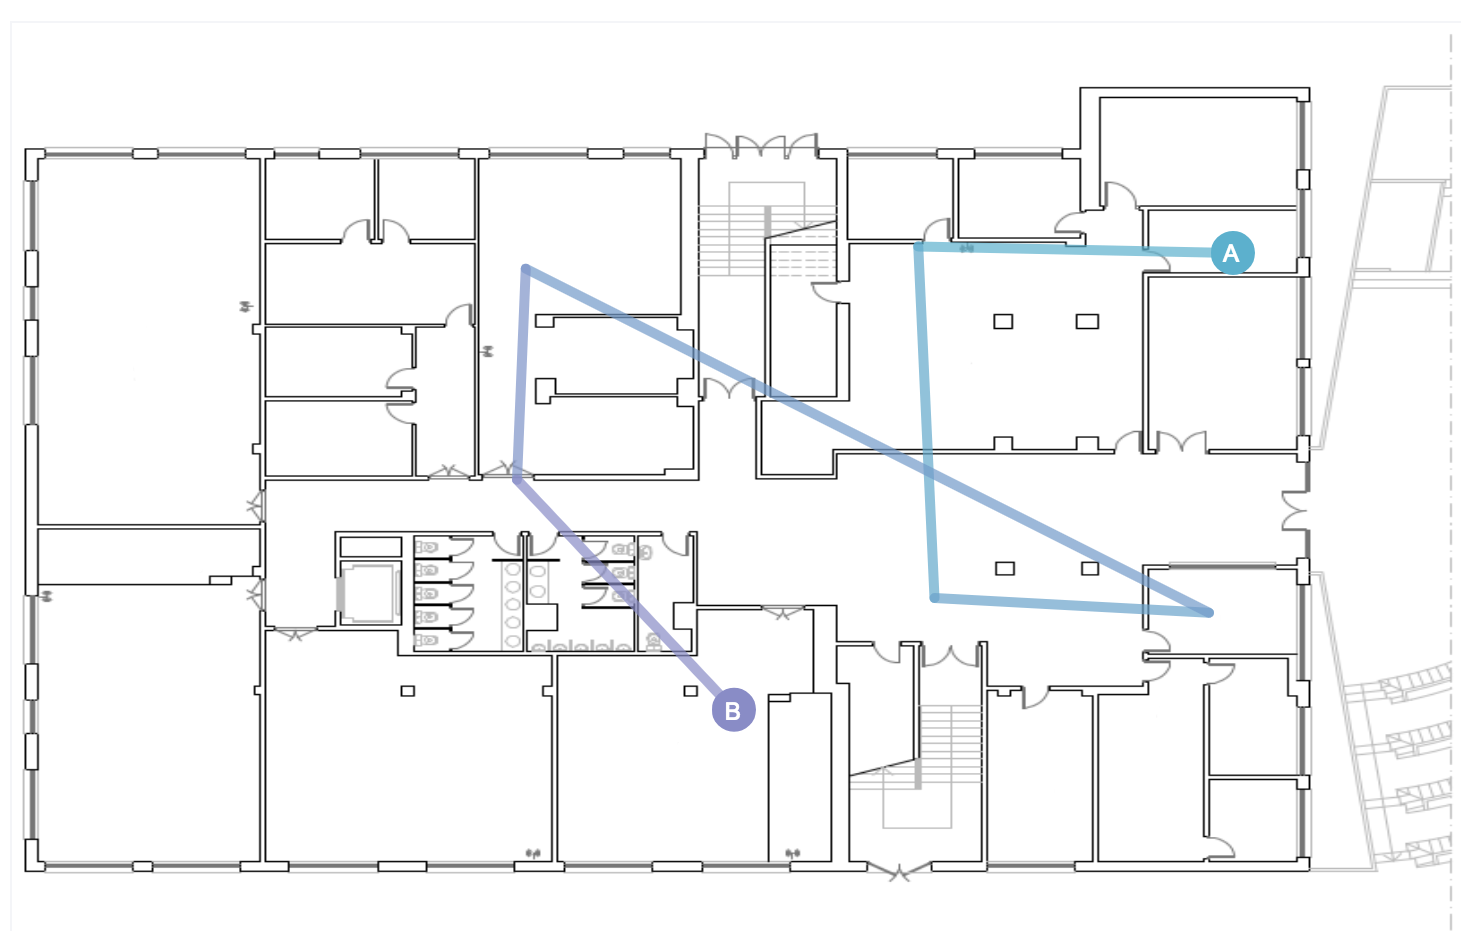
WidgetRoute
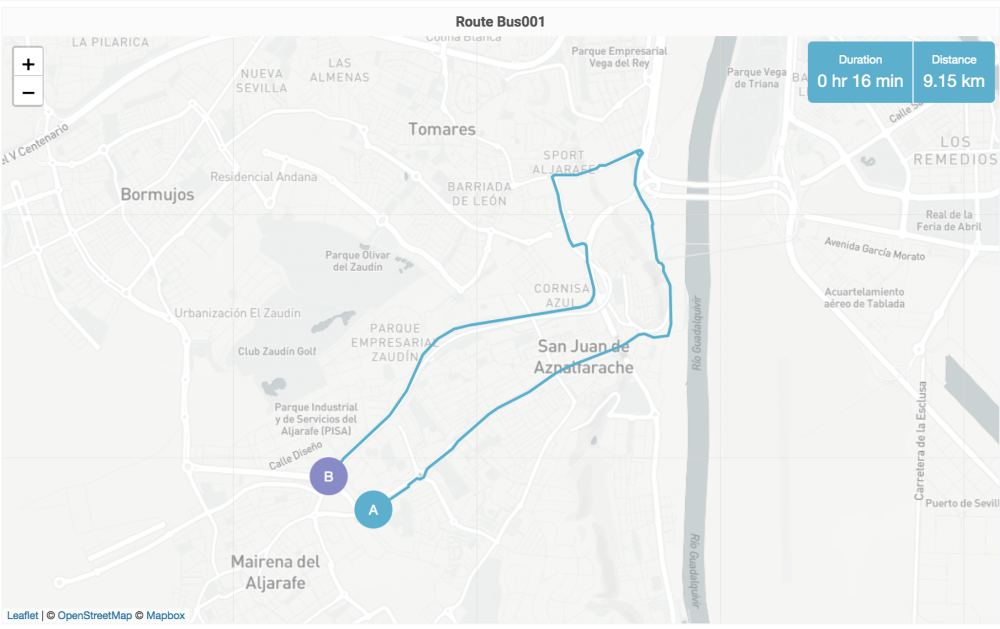
There are two ways to represent this widget. One of them using the coordinates as a dimension and another one using the coordinates as a aggregator.
In the dimension way, we have to set, apart to the required attributes:
- dimensions (two, one representing coordinates and another to represent the asset)
- aggregators (one)
- granularity (one different to
all) - limit
In the aggregator way, we have to set, apart to the required attributes:
- dimensions (one representing the asset)
- aggregators (one representing coordinates as stringLast or stringFirst aggregator)
- granularity (
all) - limit
We support three different routing profiles:
- driving
- walking
- cycling
By default, if no routing profile is selected, driving will be the one used.
Also, distance unit can be configured:
- km
- mi
By default, if no distance unit is selected, km will be the one used.
It can be set in the options attribute:
{
  "routing_profile": "driving",
  "distance_unit": "mi"
}
WidgetPlaneRoute
There are two ways to represent this widget. One of them using the coordinates as a dimension and another one using the coordinates as a aggregator.
In the dimension way, we have to set, apart to the required attributes:
- dimensions (two, one representing coordinates and another to represent the asset)
- aggregators (one)
- granularity (one different to
all) - limit
In the aggregator way, we have to set, apart to the required attributes:
- dimensions (one representing the asset)
- aggregators (one representing coordinates as stringLast or stringFirst aggregator)
- granularity (
all) - limit
It needs GPS markers to convert the latitude-longitude data to x-y points. Al least, three gps markers have to be configured.
x-y points are references for a image point starting at top-left corner of the image.
To keep the proportions of the used image, we have to use keep_ratio property.
The options attribute would be as follows:
{
  "image": "https://www.bookingtaxibarcelona.com/wp-content/uploads/2015/03/fira-gran-via-map.png",
  "keep_ratio": true,
  "gps_markers": [
    { "x": 261, "y": 208, "latitude": 41.355151, "longitude": 2.127733 },
    { "x": 530, "y": 217, "latitude": 41.357172, "longitude": 2.130533 },
    { "x": 785, "y": 406, "latitude": 41.3559, "longitude": 2.138092 }
  ]
}
WidgetImage
This is a special widget, because no Druid query will be done. However, required attributes have to be set.
Also, the attributes that can be configured using options field are:
{
  "image": "https://www.bookingtaxibarcelona.com/wp-content/uploads/2015/03/fira-gran-via-map.png",
  "keep_ratio": true,
  "opacity": "1",
  "image-link": {
    "url": "/dashboards/43",
    "type": "dashboard"
  }
}
To keep the proportions of the used image, we have to use keep_ratio property.
A link could be associated to the image. When clicking, it will open the url, that could be an external resource ("type": "absolute") or a dashboard link ("type": "dashboard"). You can redirect to the previous page by setting the property url to back ("url": "back").
WidgetHistogram
It will represent a Timeseries query. This widget will use a histrogram aggregation.
It will have two ways of representation:
- Representation of result fetched from Druid.
- Each value will discard the value of the previous section.
In addition to the required attributes, we have to set:
- aggregators (one)
- limit
We can set the optional discard values option by specifying a value between previous or next:
"options": {
  "discard_values": "previous" | "next"
}
We use the widget limit attribute to specify the numBuckets. And the default value for the histogram type is ‘equalBuckets’, so to configure numBuckets we’ll only need:
"limit": 5,
"options": {
  "discard_values": "previous" | "next",
  "histogram": {}
}
To configure customBuckets through options:
"limit": 4,
"options": {
  "discard_values": "previous" | "next",
  "histogram": {
    "type": "customBuckets",
    "breaks": [2, 150, 200, 3000, 5000]
  }
}
This widget also has the threshold feature available.
WidgetText
This is a special widget, because no Druid query will be done. However, required attributes have to be set.
Also, the attributes that can be configured using options field are:
"options": {
  "text": "Your text",
  "fontSize": "42px"
}
Misc
Coordinates
The dimensions and aggregators could represent coordinates in the format latitude,longitude, i.e. 37.3509227,-6.0607913. They have to be named using the regexp /coordinate|latlong|latlng/.